Prologue
I am a student who decided to complete a master’s degree in Digital Investigation and Identification at the University of Lausanne. As part of this, I had to choose a personal practical lab theme for which I would take time to practice my theoretical knowledge, produce something useful, and maybe publish my results. Recently out of an internship in an Office of Police where I found myself having to review manually some Facebook profiles, I chose to try and write a script automating the processing and output of some basic visualizations of Facebook GDPR data to help investigators grab a general idea of one’s Facebook profile and its content without having to put too much work into it. That way, they can have leads about which people are the most involved in the Facebook activity of the user, and to which extent the user is active on Facebook. Unusual activity will also hopefully be easily detected based on the visualizations produced. That information can be used to orient the investigation and help prioritize the actions taken.
GDPR what?
The GDPR law (General Data Protection Regulation) is “a regulation in EU law on data protection and privacy in the European Union and the European Economic Area. The GDPR’s primary aim is to give individuals control over their personal data (…). Data subjects have the right to request a portable copy of the data collected by a controller in a common format, and the right to have their data erased under certain circumstances.” Wikipedia
It is in this context that Facebook makes available all the data collected on a user via the interface of his account settings, and it is this data that I decided to analyze. You can find yours following these steps:
-
First, go to Facebook and log in. Then, click on the
Accountbutton.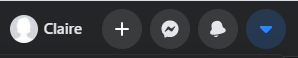
-
Go to
Settings & privacy.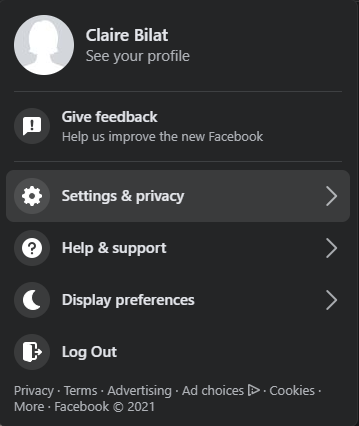
-
Go to
Settings.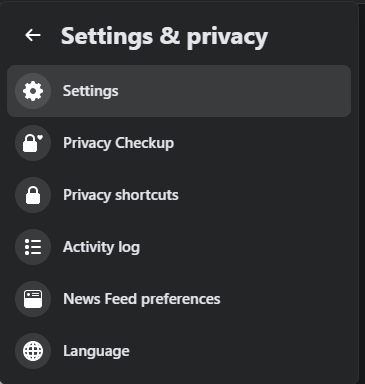
-
Go to
Your Facebook information.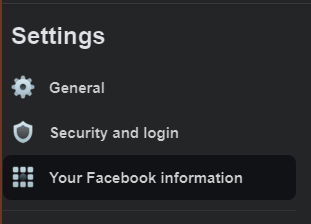
-
Go to
Download your information.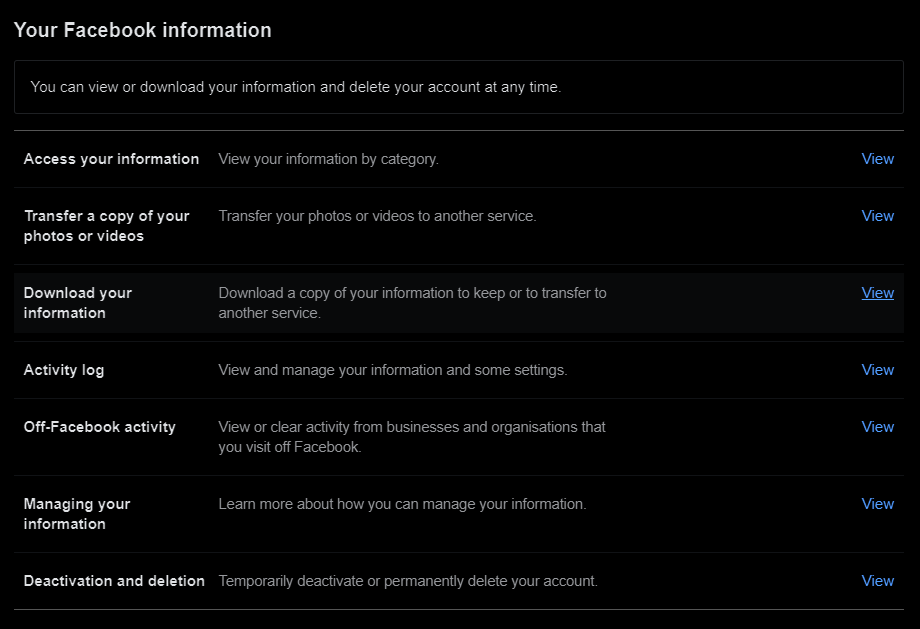
-
Choose
Request copy, adjust your parameters, and click onCreate File. Note that to use my script, you must select the JSON file format. Also, if you do not need the media in high quality (for many data analysis implementations you will just not need the media at all), consider selecting the lowest quality, as otherwise, your Facebook Download Data will become very huge.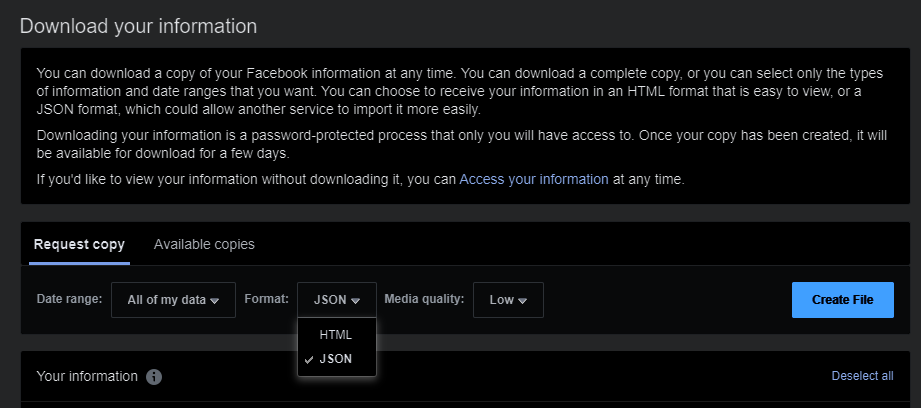
-
When the file is processed, you will receive an email and a Facebook notification, and the file will be available in the
Available copiessection just right to theRequest copysection. You can then just download it on your computer, and you are all set.
The downloaded folder contains many folders that contain different JSON files with which you can reconstruct every action you ever performed on your Facebook account. Note that if you never used a functionality offered by Facebook (let say you never “poked” anyone for example), the corresponding JSON file/folder will be absent from your Facebook Download Data and it will not be present as an empty file/folder. Thus, it is impossible to exhaustively construct a list of every possible file you may encounter in your Facebook Download Data.
Has it already been done?
Many people have done similar projects (but it is a real pain trying to find them online because of all the Facebook scandals that pop when searching form terms like Facebook data analysis… Quick tip, try with keywords like “Analyze Your Personal Facebook Data” and exclude some keywords like “Analytics” and it will be a little bit better). Here is a list of some of the projects I found that use Python (which is the language I selected for my project):
-
Do you post too much? Analyze your personal Facebook data with Python (Charlie Custer, Dataquest, 28.08.2020)
This is a great tutorial that is surprisingly easy to follow, explaining in well-illustrated steps how to plot your monthly post count using Pandas and Matplotlib (those are Python libraries containing useful functions for data analysis). It takes five minutes to perform and is a really great way to introduce you to the structure of the data Facebook offers. Here, they limit themselves to the analysis of the user’s posts content.
-
Mapping My Facebook Data – Part 1: simple NLP (Hunter Heindenreich, towardsdatascience, 21.08.2018)
This article explains how to discover what words you use most, and basic stats about your data. It is out of the scope of my project but is 100% considered as a prospect. It is also quite short and easy to follow. They aggregate various sources of information, like the inbox content, the user’s posts content, and the user’s comments. However, the analyzer they used (from the library NLTK) only works for English sentences.
-
Livestream: Analyzing Facebook Messenger Data with Python (Ian Freed, Codecademy, 01.11.2018)
If the two previous articles were not detailed enough and you need a step-by-step video-commented tutorial, this will be your life changer. They limit themselves to the analysis of the inbox content, but every step is illustrated and commented, so if you are a complete beginner to data analysis, I highly recommend trying to follow this 1h-tutorial. They perform sentiment analysis on the exchanged messages (this is used to determine whether the conversation has a more positive or negative polarity - basically, whether the topic was happy or sad), and study the variation of polarity over time. They use libraries like Pandas and Matplotlib. However, the analyzer they used is the same as the one used in the previous article, so it only works for English sentences.
-
Analyzing your Facebook Data in Python (Leada)
This supposedly is a MOOC course guiding through a series of interesting analysis on your Facebook Download Data using tools like Pandas, Scipy, and Plotly. However, it was not available at the time I tried to enroll so I could not check the actual content of this course.
How did I do it?
I chose to use the libraries Pandas and Plotly. Explaining how exactly I implemented my script is not the purpose of this article and is not the most thrilling part so I will not go over every detail of it. I will however mention a few ones that could maybe help the reader to gain a better global comprehension of the project and illustrate the difficulties I encountered.
Basically, before being able to analyze the data, I had to preprocess it and reformat it so that the structure would be coherent between every source I was planning on using. This step definitely was the most painful. First, there is no official documentation available about the organization of the Facebook Download Data, and you just have to deduce what the data represents by looking at what you have in front of you. To this day, there are still some files for which I could not extrapolate the meaning of the data they contain. And then, as you think you have a good idea of what the data represents and you want to use it, you will face the next problem. Indeed, every folder that the Facebook Download Data contains shows a different structure and it is mostly nested sub-columns in each row that are still in JSON format. In consequence, I had to manually review each folder individually and study its structure to extract some useful content, and that cannot be automated.
Also, the textual information in the Facebook Download Data is incorrectly encoded. The original data is UTF-8 encoded but was decoded as Latin-1 (no, it is not just me going crazy, StackOverflow talks about it), which I had to take into account each time I wanted to interpret textual values.
Last but not least, the data is not well tokenized and most of them are just textual strings describing the action resulting in this entry. As an example, I can cite the file containing information about group membership activity (search for the file groups/your_group_membership_activity.json). The entries it contains can be at least two of the following strings:
-
“You became a member of group xy” (in French “Vous êtes devenue membre de xy”).
-
“You stopped being a member of group xy” (in French “Vous avez arrêté d’être membre de xy”).
There are three problems with that :
-
You have to manually check every type of entry in the file and apply some regular expressions searches to identify exactly the action corresponding to the entry (“quit” or “joined”, and the name of the group).
-
It is language-dependent, as the entry is expressed in the language chosen by the user at the time (so you will probably have to check that in the JSON file containing information about the user’s settings).
-
Depending on the language (and it is the case in French), it is even gender-dependent, so the string will not be the same depending on the individual settings of the user.
It becomes worse, as the string itself changes over time depending on the version of Facebook and the conventions they are applying at the time, an example being the entries in the file recording the correspondences with Facebook Support (search for the file other_activity/support_correspondences.json), where I found two possible strings describing the anonymous signaling of a publication :
-
“You have anonymously signaled the publication of xy for abc reasons” (in French “Vous avez signalé anonymement la publication de xy pour abc”).
-
“You have signaled the publication of xy in an anonymous way for abc reasons” (in French “Vous avez signalé la publication de xy de manière anonyme pour abc”).
In consequence, the regular expressions used must be really robust in order to work on every string version of the action one is trying to tokenize.
To conclude, the high variability of formats encountered in the Facebook Download Data makes it difficult to dig deep in an automated way and must be adapted case-by-case to achieve a high granularity of details. The purpose here being to offer a general understanding of the activity one has on Facebook, I decided to not lose myself in the management of every case I ran into and did not implement any regular expressions, as it too tightly depends on the account settings of the investigated Facebook user.
I wrote a Python script available online. Put the file facebook_script.py in the folder where you store your Facebook Download Data folder and open this destination in a terminal. Make sure you have Python and Pip installed and that they are in the PATH environment variable. Then run the command pip install pandas datetime plotly. Lastly, you will just have to run the command python ./facebook_script.py %folder_name%, replacing %folder_name% by the name of the Facebook Download Data folder you want to analyze. The results will be stored in a newly created folder %folder_name%_results.
But what is this script useful for?
After cleaning the data I wanted to use, I stored it into Pandas Dataframes and then saved it into CSV files. Each of those CSV files can be found in the results folder if the corresponding JSON file was available in the Facebook Download Data folder. Those CSV files and their content are described in the annex. Note that I chose to construct Dataframes from the JSON files that I identified as pertinent based on the four Facebook accounts I had at my disposal. It is not an exhaustive list of the information you can retrieve from the Facebook Download Data and should be adapted to your case. Also, some keys I used to identify the presence of information have been selected in French, as the four profiles I had at my disposal were in French. This is the case for the Dataframes see_first, see_less, blocked_contacts, notifs_pages, profiles_visited and pages_visited, which will thereby only exist if the user’s Facebook language setting is French or if you adapted the key strings in the script before running it.
Each Dataframe created was exploited to create a visualization of the monthly count of actions performed by the user, per type of action (see next section). Some of the Dataframes have also been individually exploited to create more detailed visualizations, for example, the monthly count of exchanged messages in private conversations, per interlocutor (also see next section).
You can visualize the content of the CSV files with Excel but be careful to choose 65001: Unicode (UTF8) as “File origin” when opening the CSV files, or the text will be displayed with encoding errors. To do so, follow these steps:
-
Open a clean data sheet in Excel.
-
Select the
Datatab and click onFrom a text file/CSV.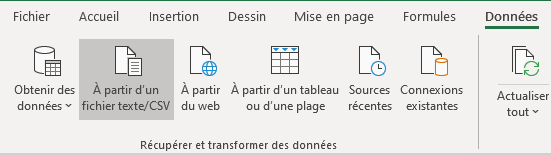
-
There, you can select the desired
File originand you are ready to go.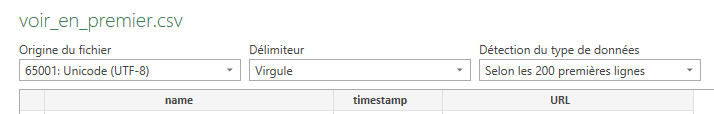
Visualizations
Each visualization is saved in an HTML file and can be found in the results folder. When they are open in a browser, you can zoom in or out to adapt the time range displayed, and you can click on the actions listed at the right of the graph to select the ones you want to display.
Monthly count of Facebook actions, per action (std lower than 10)
This graph (month_count_actions_small-std.html) shows the count of Facebook actions the user performed per month, and you can filter the different actions displayed. I chose to limit the visualization to the actions showing a standard deviation of monthly count lower than 10 so that the visual comparison would be easier. As those are the actions performed regularly by the user (like adding new friends or liking new pages in my case), it helps to gain a general understanding of the usage of the Facebook profile.
By navigating it, you can see that I liked pages (action liked_pages) mostly between 2016 and 2018, with a high peak in January 2017 where I liked 52 pages. I do not really explain this observation, but it could still be of value for investigators, as it helps to target some unusual activity and describe what is considered as usual for a user.
Most of the friend requests I rejected (action rejected_friend_requests) took place between the end of 2015 and mid-2016, but the removal of friends (action removed_friends) took place mostly between 2011 and 2013. One hypothesis is that maybe I was accepting every request before 2014 and was removing the ones I was not so sure about just a little bit later, when as from 2015, I started rejecting the friendship requests directly.
Some precautions have to be taken when interpreting those data. For example, my “poking” activity (pokes action) only lasts until the end of 2018. It can easily be explained by the fact that Facebook removed this functionality at the time.
Monthly count of Facebook actions, per action (std higher than 10)
This graph (month_count_actions_high-std.html) shows the count of Facebook actions the user performed per month, and you can filter the different actions displayed. I chose to limit the visualization to the actions showing a standard deviation of monthly count higher than 10 to illustrate the unregular activities of the user.
Many observations can be made. As you can see when displaying the msg_requests action, I have a big peak of message requests in September 2018, and almost none the other months. I checked my inbox out of curiosity, and it turns out that, in September 2018, people I did not know added me in a group conversation. Before I had the time to decline the invitation, they sent almost 500 messages in this conversation, and then deleted me from it. That explains this anomaly.
When displaying archived_threads, you can see that I also have enormous peaks of archived conversations between June and September 2017 and almost nothing in the other months. During this period, I actually quit the associative role that I had since January 2017 and archived the conservations I had with my colleagues, also explaining this anomaly.
As you can see, I easily targeted unusual activity based on the visualization and could rapidly check in the data the cause of this activity, which could be helpful to investigators.
Monthly count of exchanged messages in private conversations, per interlocutor (total count in top10 or max month count in top10)
This graph (month_count_inbox_private.html) shows the count of Facebook messages the user exchanged per month in private conversations (meaning in conversations with only one other person than the user), per interlocutor, and you can filter the different interlocutors displayed. I chose to limit the interlocutors represented to the 10 with whom the user exchanged the most messages in total, and/or the 10 with whom the user exchanged the most messages in one month, so that the visual comparison would be easier. The graph displayed here is an anonymized version of the graph I obtained with my data.
It is a bit difficult to make conclusions based on the anonymized version of this visualization, but I encourage you to do the same with your data. Also, please be careful to note that the user “Utilisateur de Facebook” in French (probably “Facebook user” in English) often appears in this graph but is only an aggregation of every conversation where the interlocutor deleted his profile, making his name unavailable. This visualization helps quickly identify the people often contacted (with Facebook Messenger) by the user and could help target the next person to interview in an investigation.
Monthly count of exchanged messages in group conversations, per interlocutor (total count in top10 or max month count in top10)
The same has been performed for group conversations (meaning in conversations with more than one other person than the user). You can also filter the different groups of interlocutors displayed on the graph (month_count_inbox_group.html).
We can see that I have almost no group conversations, apart from the period of January to September 2017. Again, those conversations are related to the associative role I had at the time and explain this activity. Based on this visualization, unusual activity can easily be targeted and can rapidly be checked in the data. Also, it helps again to quickly identify the people often contacted (with Facebook Messenger) by the user and could help target the next person to interview in an investigation.
Other graphs
You will find two other graphs in the results folder, that I will not discuss in detail as the anonymized versions of mine are not as clear as the other visualizations I discussed.
The graph month_count_groups_comments.html illustrates the monthly count of messages the user posted in groups, per group, for the groups with a total count in the top 10. In my opinion, it could be useful to detect the groups where the user is the most active and filter it based on the group name. Some of the groups could be linked to topics of interest for the investigation, and the extent of the user’s activity on them would be easily displayed on this graph.
The graph month_count_searches.html illustrates the monthly count of searched items, per item, for the top 10 items that have been searched the most in total and/or in one month. The profiles, groups, or pages being the most frequently searched by the user can be observed on this graph and can also help to reconstruct the user’s interests.
Conclusion
I hope I could convince you that such a script is easy to implement and of added value in an investigation. It is fast and produces useful visualizations from which it is easy to extract information of interest. Moreover, some Dataframes I cleaned based on the JSON files I had are intrinsically pertinent and should manually be reviewed, for example, the list of apps linked to the account, the list of events joined, or the list of pages administered by the user (see at the end of this article for an exhaustive list of every Dataframe created with my script).
Prospects
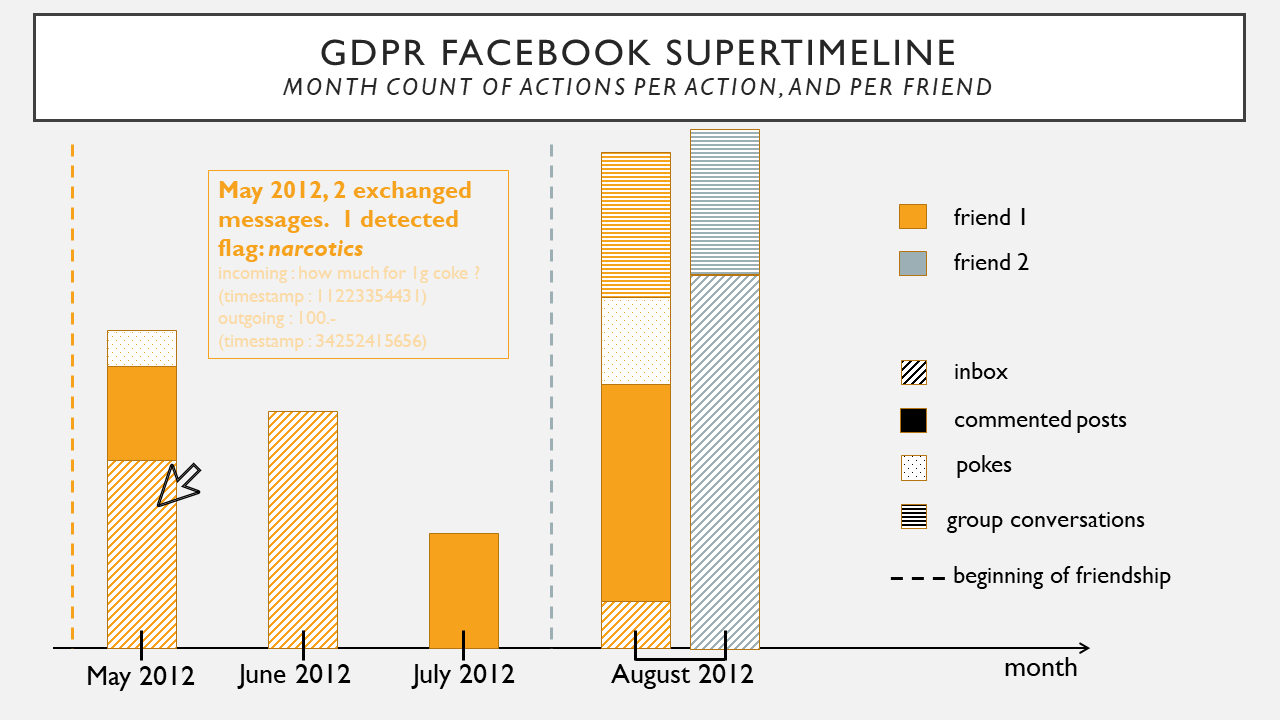
What I initially wanted to do but had to let go because of the problems raised in the How did you do it? Section was to create a timeline of actions per friend, combining many sources of information like when did the user and the friend connected, their inbox, but also the comments they posted on each other’s posts, the events they invited each other at, etc. You could filter by action, by friend, and by time period.
What would be very beneficial from an investigative point of view would be to perform some Natural Language Processing on the textual sources like the inbox, the comments, etc., to begin to know better the topics of interest and the vocabulary/intentions of the user. Also, this could help narrow down the friends with whom the user actually has conversations/activities of interest, which would also be useful. This information could be added to the supertimeline I mentioned, so that when you click on a certain portion of the visualization, the details related to it could appear, for example, the detected topics of conversation.
An illustration of how I imagined it is just below.
Annexes: description of the CSV files created with the script
-
apps_and_websitesThis Dataframe contains information about the apps that have been linked to the considered Facebook account. It has forensic value as it can orient the investigator to other sources of traces and potentially valuable information, and it should be manually reviewed.
-
archived_threadsThis Dataframe contains the discussions that the user has left. It has not been used here for independent visualizations as my account did not have many different deleted conversations, but if the general overview of the account activity shows that this Dataframe is highly populated, the script could be adapted to take that into account.
-
comments_in_groupsThis Dataframe contains every post or comment the user performed in groups. The group name is already tokenized and has been exploited to produce a visualization of the monthly post/comment count per group. This can be used to see if the user is very active in some groups that could be related to specific activities (illegal sale, harassment, …).
-
commentsThis Dataframe contains every comment the user posted on profiles or pages. It has not been visualized as the action is not tokenized and neither the comment nor the page or the profile can easily be extracted.
-
event_invitations,events_declined,events_interested,events_joinedandevents_visitedThese Dataframes contain information about the events the user has been invited to, the ones he declined, the ones he expressed his interest in, the ones he joined, and the ones whose event page he visited. Those have forensic value to check if the user expressed interest in events planning illegal activities and should be manually reviewed by the investigator.
-
filtered_threadsThis Dataframe contains message requests that have been declined by the user. It has not been used here for independent visualizations as my account did not have many different filtered conversations, but if the general overview of the account activity shows that this Dataframe is highly populated, the script could be adapted to take that into account.
-
followed_pagesThis Dataframe contains the pages that the user follows (note that follow is not the same as like, give it a try on Facebook to understand the difference).
-
followingThis Dataframe contains the people that the user follows (note that follow is not the same as being friend, give it a try on Facebook to understand the difference).
-
friendsThis Dataframe contains the user’s friends.
-
groups_joinedThis Dataframe contains the groups in which the user has taken part. Be careful, if the user has left the group, only one entry remains in the Dataframe and the timestamp corresponds to the departure.
-
groups_visitedThis Dataframe contains the groups whose pages the user has displayed.
-
inboxThis Dataframe contains the messages that the user exchanged in conversations. Two visualizations have been made based on this Dataframe; one illustrating the monthly exchanged messages count per group conversations and the other one per private conversations.
-
liked_pagesThis Dataframe contains information about the pages the user has liked. Those have forensic value to check if the user expressed interest in specific topics regarding the investigation and should be manually reviewed by the investigator.
-
liked_posts_and_commentsThis Dataframe contains every Facebook reaction (HAHA, LIKE, LOVE, WOW, etc.) the user selected on various posts and comments. -
msg_requestsThis Dataframe contains every message sent as a request from people that were not on the user’s friends list. Once accepted, they migrate to the inbox. If declined, they migrate to the filtered_threads.
-
peopleTo be honest, I do not really know what represents the data in the JSON I used to construct this Dataframe. More experimentations would be required to know for sure what action populates the JSON file I extracted these data from.
-
pokesThis Dataframe contains every poke exchanged by the user. Please note that “poking” is a functionality that did not exist on Facebook for very long and it can explain why the “poke activity” of a user suddenly stops.
-
received_friend_requestsThis Dataframe contains the friend requests the user received. Please note that once they have been accepted or denied, they are not present in this Dataframe anymore. The data represents therefore the pending requests.
-
rejected_friend_requestsThis Dataframe contains the friend requests the user rejected.
-
removed_friendsThis Dataframe contains the friends the user removed.
-
search_historyThis Dataframe contains every search performed by the Facebook user. I have exploited this to plot the monthly count of searches per item searched.
-
sent_friend_requestsThis Dataframe contains the friend requests the user sent that have not been accepted or rejected yet.
-
supportThis Dataframe contains every request the user made to Facebook support, including anonym denunciations of posts or comments. It has forensic value in some cases like online harassment and should be manually reviewed by the investigator.
-
unfollowed_pagesThis Dataframe contains every page the user unfollowed.
-
profiles_visitedTo be honest, I do not really know what represents this Dataframe, as mine is only populated with less than 10 entries and I definitely visited more profiles than that. More experimentations would be required to know for sure what action populates the JSON file I extracted these data from.
-
pages_visitedTo be honest, I do not really know what represents this Dataframe, as mine is only populated with less than 10 entries and I definitely visited more pages than that. More experimentations would be required to know for sure what action populates the JSON file I extracted these data from.
-
see_firstThis Dataframe contains every profile the user chose to see first in his feed. This could be of interest depending on the case and should be manually reviewed by the investigator.
-
see_lessThis Dataframe contains every profile the user chose to see last in his feed. This could be of interest depending on the case and should be manually reviewed by the investigator.
-
your_pagesThis Dataframe contains every page where the user is an administrator. That has high forensic value and should be manually reviewed by the investigator.
-
blocked_contactsandnotifs_pagesThose are related to some settings of the user’s profile, but I did not encounter them in my data so I could not extrapolate their meaning.
Note that each Dataframe could be of forensic value depending on the context and the tips I give are not exhaustive.